Linear regression in Excel – continued

Doing linear regression in Excel is simple. Now I’d like to show you how exactly this is done.

Let’s use the same data set:

x 9.42 2.78 5.87 5.49 6.48 4.91 7.82 2.70 2.65 8.42 5.85 0.93
y 52.24 4.15 13.72 7.00 5.28 6.98 42.00 7.15 3.41 31.00 12.59 1.09

Let’s say we want do a order-2 linear regression. That means, we want a function:

f(x)=c*x^2 + b*x+a

a, b and c should be chosen in a way such that if we put x into f(x), the difference/error between f(x) and y, will be minimized, in the least square sense.

So we have the difference R as a function of a,b,c:

R(a,b,c)=(c* 9.42^2 + b* 9.42 + a – 52.24)^2+(c*2.78^2+b*2.78+a-4.15)^2+…+(c*0.93^2+b*0.93+a)

R is smooth every where in space. So R is minimal where:

D(R)/D(a)=0; D(R)/D(b)=0; D(R)/D(c)=0

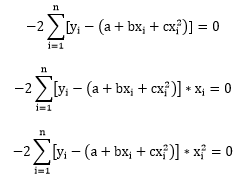
Now we’ll have to employ the compact form to avoid tedious typing:

equ1

In order for R to be minimal, we need:

equ2

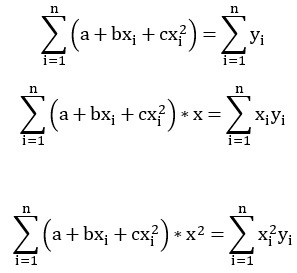
Insert R into the equations and expand them, we get:

equ3

That is:

equ4

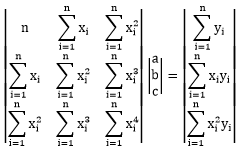
Or in matrix form:

equ5

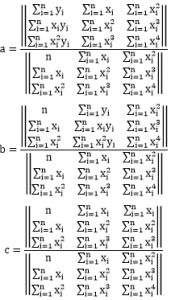
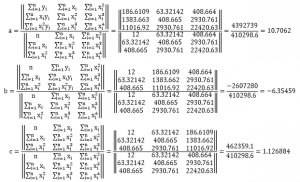
Now this is a very simple equation, so we can simply solve it using Cramer’s rule:

equ6

It looks scary but actually not too complex. We need the sum of x, x^2, x^3, x^4, x*y and x^y. We can actually verify this in excel:

x y x^2 x^3 x^4 x*y x^2*y
9.42 52.24 88.69578 835.323 7866.942 491.974 4633.334
2.78 4.15 7.721688 21.45697 59.62447 11.53932 32.06537
5.87 13.72 34.43254 202.0476 1185.6 80.52797 472.5321
5.49 7.00 30.18894 165.8715 911.3719 38.47401 211.3934
6.48 5.28 41.99053 272.099 1763.204 34.19838 221.6059
4.91 6.98 24.08858 118.227 580.2595 34.23907 168.0457
7.82 42.00 61.22442 479.0568 3748.43 328.6334 2571.426
2.70 7.15 7.269068 19.59829 52.83935 19.27266 51.96143
2.65 3.41 7.003793 18.53532 49.05312 9.028243 23.89296
8.42 31.00 70.90802 597.0945 5027.948 261.0414 2198.149
5.85 12.59 34.27254 200.6409 1174.607 73.71933 431.5732
0.93 1.09 0.869064 0.810173 0.755272 1.014426 0.945685
63.32 186.61 408.665 2930.761 22420.63 1383.662 11016.92

So we have:

calculation_0

calculation_1calculation_2

calculation_3

So in the end we get:

cal_result

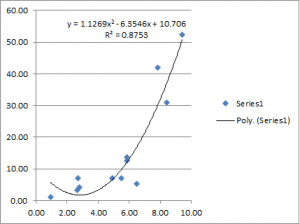
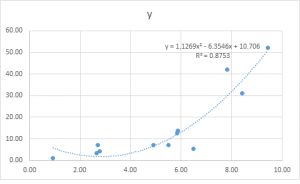
This is exactly what Excel displayed on the chart:

trend_line_res

I actually put all this in an Excel file so you can try it yourself. Please note that in the excel file we have a data set of 12 points. If your data set has a different size, you may have to adapt the formulas a little bit. 🙂

Linear regression in Excel

Excel has a very handy feature that does linear regression for you very intuitively.

Let’s say you have a data set like this:

x 9.42 2.78 5.87 5.49 6.48 4.91 7.82 2.70 2.65 8.42 5.85 0.93
y 52.24 4.15 13.72 7.00 5.28 6.98 42.00 7.15 3.41 31.00 12.59 1.09

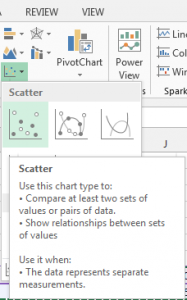
First, you’ll have to insert a scatter chart:

insert_scatter_chart

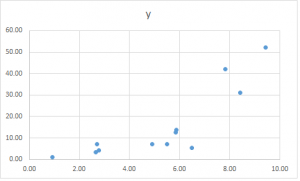
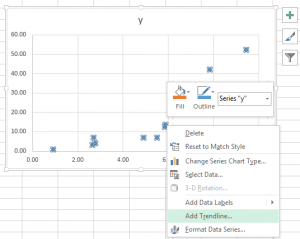
You’ll get a chart like this (Excel is smart enough to figure out what should be the x-axis and what should be the y-axis):

scatter_chart_ex1

Now, right click on the dots and then you can select “Add Trendline…” from the pop-up menu.

add_trendline

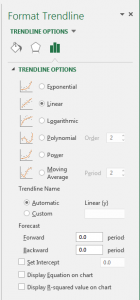
Then you’ll be presented with a dialog like this:

trend_line_options

Note that Excel has different options for “Linear” and “Polynomial”. Here the option is about the relationship between the variables. All these different options are all Linear Regressions.

Let’s try a order 2 polynomial regression and check the option “Display Equation on chart” and “Display R-squared value on chart”. This is what you’ll get:

order_2_regression

Good thing about doing this in Excel is, you can always change the data set and your chart and equation will be updated automatically.

Depending on the nature of your data set, you may want to try different model to get a better fit, the procedure will be the same.

Windows mind set vs. Linux mind set

I wanted to talk about this for a long time, however, the key points were not clear until recently I ran into the pipeline concept in PowerShell.

When you do pipeline in PowerShell, you’re passing not a text stream from the left command to the right command, but rather, you’re passing a .net object.

When I read this from TechNet, I smiled to myself, yes, this is typical Microsoft!

Windows PowerShell provides a new architecture that is based on objects, rather than text. 
The cmdlet that receives an object can act directly on its properties and methods without 
any conversion or manipulation. Users can refer to properties and methods of the object by
 name, rather than calculating the position of the data in the output.

And I said to myself, now I know what I wanted to say.

One key difference between Windows and Linux is, Windows always tries to be smarter, where GNU Linux tries to stay plain and humble. Pipeline in scripting is just one recent example.

Linux has been using text configuration files. Windows came along and said, we need something better. That’s how Windows Registry came about.

Linux has been using pipeline for IPC. Windows came along and said, we need something better. That’s how COM came about.

Linux has been using lock files to prevent processes to start another instance. Windows came along and said, we need something better. So they use Kernel Object instead.

Linux has been using permissions as a basic security measure. Windows came along and said, we need something better. So they do everything using ACLs.

Linux has been using symbolic links. Windows came along and said, we need something better and introduced short cuts.

To be fair, not all of them are bad ideas.

Despite its complexity and awkward configuration, COM gained such popularity that it became the basic foundation of modern Windows. Open registry in any Windows that has been used for a while and chances are the biggest tree is HKLM\Classes\CLSIDS. (One of the key reasons why you Windows becomes slower as you install more and more software).

Kernel Object is much more reliable than lock files. ACLs indeed provide much flexibility in terms of access control. Linux is also doing it now.

However, we all know that Windows have record of being smart in cheap ways and then fail pathetically. (SilverLight is the one that came into my mind as I write this) To me, this idea of passing objects through pipeline looks like just another one that will fail.

Having said that, I have to admit that, this difference between Windows and Linux is also not surprising.  Linux is developed by community led by technical experts. Introducing new features always involves extensive discussions between these experts.That’s why Linux has a bad reputation of not listening to its users.

Where as for Windows, most likely, new features are proposed by requirement collection team and developer team, then the list of new features have to go through rounds of prioritization processes. If there are disputes, then there will be escalations and some manager will decide. Once decided, then features still in the list will be implemented. Period.

Now, it is actually surprising that Microsoft actually made some key decisions right, right? 🙂

Monty Hall Problem simulation in Excel

Monty Hall Problem is definitively the most confusing puzzle among educated people. After explaining this to different colleagues and friends (With a success rate below 50%), I found it’s easier simply presenting the fact. So here’s a simulation of it in excel.

monty_hall_excel

Let’s me explain a little bit about this excel:

Each row in the table is a test case, or an experiment.

In each such a experiment, a random number is generated to determine where do we put the car. A goat will be placed behind each of the rest doors. So in the table, we have “C” denotes a Car and “G” denotes a goat.

If the number is between 0-1/3, then the car will be placed behind Door1. If the number is between 1/3-2/3, then the car will be placed behind Door2. If the number is between 2/3-1, then the car will be placed behind Door3.

Then in the 6th column of the table, another random number is generated to determine the 1st choice.

Again, if the number is between 0-1/3, that means the guest chose Door1 in the first attempt. If the number is between 1/3-2/3, then the guest chose Door2 in his/her first attempt. If the number is between 2/3-1, then he/she chose Door3 in his/her first attempt.

Note that both of the 2 random numbers have a unify distribution between 0 and 1. And the 2 numbers are completely independent to each other.

Also in the table, the guest’s first choice is high-lighted in green.

The next column, the 7th column, shows what the guest will get if he sticks to his/her first attempt. And the 8th column shows whether he/she wins a car or not. (1 wins, 0 loss).

The 9th column shows what the guest will get if he/she switches to the other door when he/she is given another chance. And the next column shows whether he/she will win or not if he switches.

In the end of the table, after 400+ experiments, the outcome of the 2 strategy was summed up. Out of 432 experiments, you’ll get a car 142 times, if you stick to your original choice, you’ll get a car 290 times, if you switch.

The good thing about this excel is, you can simply press F9 and ask Excel to recalculated and see with your own eyes of the outcome.

What slows down your Windows?

Windows has long been complained of performing slower and slower as being used. This essay tries to explain how and why.

Before we go into details, let’s make it clear that we’re talking about the architecture design of Windows that makes it not performing in certain situation. So this is consistently measurable performance difference. We’re not talking about bad performance because of wrong configuration. Nor are we going to talk about performance of a specific program.  A specific instance of slow down, for example, your notepad will performance slower when you have a lot of other programs running, is not what we’re going to talk about.

First of all, there’s no reason Windows should perform worse (or better) if you just spend more time on it. If the installation keeps the same, the size of your computer keeps the same, Windows should perform the same.

However, if one of your running programs or a device driver has memory leak, then it will eat up more and more memory as time pass by. That will slow down your Windows. The unique thing about this type of performance issue is, after a fresh restart, Windows should perform well. In the early days, memory leak was a common issue on Windows. That attributed much to the common belief that you should restart your Windows once in a while to keep better performance. Now, most commonly used program is mature enough to be free of memory leak, Windows should perform just the same as time goes by.

However, as time goes by, you’ll probably keep installing new software on your Windows. This could indeed slow down your computer. The reason is, by installing any non-trivial software, you’re not only copying files to the disk, but also registering COM components to Windows. These registry key/values will be keep in memory. So the more software you install, the less memory your program will be able to get.

As an example, after you install a program that is able to open a new file format, chances are:

  • You’ll not be able to see a thumb nail that shows the content of the file in Explorer;
  • You’ll see this program listed in the pop-up menu of this file type;

They were made possible using COM technology that depends heavily on Windows Registry.

The problem is, this registry keys/values won’t get cleaned up when you uninstall the software. So Windows registry keeps growing and growing, your programs have lesser and lesser memory to use.

The other factor that would for sure slow down your computer is disk fragmentation. Disk fragmentation affect performance not only when your program does disk IO. If your page file is fragmented, paging operation will be slow. That will cause noticeable sluggish. Also remember that all executable files and dll files become memory map files, so if they are fragmented, your program will be slow not only during start up, but also in running phase.

Bloated registry and disk fragmentation are the two reason that your Windows slows down in the long run. In some of my Windows computers, I actually create separate partitions for page file, for outlook pst file and Windows tmp file. These techniques worked quite well.

泊松分布在容量管理中的应用

其实是泊松分布的经典应用:

已知某呼叫中心每小时会进ci个电话,每个电话平均时长为tp,则在任意给定时刻,并发电话的为x的概率服从泊松分布。此处假设不同的电话是完全独立事件。

并发电话为x的概率,等同于在tp时长内,进入x路电话的概率。在tp时长内,平均会进的电话数为tp*ci。因此,并发电话小于或等于x的概率为(excel公式):

POISSON(x,tp*ci,TRUE)

其中最后一个参数TRUE,表明这里计算的是并发电话小于或者等于x的概率;如果用FALSE,则只计算等于x的概率。

此公式可用于呼叫中心容量规划,比如:如果已知呼叫量和平均通话时长,则要确保容量在99%的情况下够用,则只需求x,使得POISSON(x,tp*ci,TRUE)>0.99。

在某呼叫中心,把历史数据应用了一下,符合度很高:

call_vol_verification

其中横轴是时间,黄色为实际并发量,蓝色为按照0.999计算出的并发量上限。

如果把横轴改成按照实际并发量排序,则得到:

call_vol_verification_2

可以看到实际并发量几乎总是在预计容量之下。几个实际并发量高于预计容量的情况,后来证实都是系统出了故障,导致客户竞相反复拨打,意味着不仅原来的参数不再适用,独立同分布的假设也不再适用。


Illusions well illustrated

The documentary Test you Brain from National Geographic is awesome!

Illusions are well known to human, but not all of them have been well illustrated in action. The problem is, some of the illusions are very  best described in experiment to shows all the intricacies. For that we need carefully designed experiments and video making. This is the first time I saw something like this is made.

As an example, here’s how this documentary illustrated an attention saturation situation devised in David Copperfield’s studio:

First you see a magician told you that he wanted to do something not at all legal with money. After showing you the cash, then messing around it, the silently putting it back to his pocket, you’re asked, “did you notice anything?”.

vlcsnap-2012-01-30-08h41m37s953

Of course you didn’t. Then the video rewind and show you what had happened before and after.

Then another video shot by a camera from another angel showed you these changes were made actually well you were watching. You didn’t notice only because you didn’t pay attention to them.

vlcsnap-2012-01-30-08h47m43s393

vlcsnap-2012-01-30-08h42m18s374

So after you see this, you cannot help to say to yourself, aha, that’s how they’ve deceived me. But then you have to rethink about perception and illusion.

While it’s not available in Youtube, we Chinese can already watch it here:

Documentaries that worth noting

Have been watch documentaries for years now, especially BBC ones. Looking back, not every one of them left the same impression or impact. Here are the ones I’d like to share with others (With links to docuwiki.net, where you can find more information about these documentaries):

Another great documentary from Simon Schama

After “Power of Art”, I’m a fan of Simon Schama now. Two weeks ago I downloaded “A history of Britain”. I haven’t finished it yet, but it’s already ranked very high in my list. 🙂

Something in common in these 2 documentaries: In both of them, there are great music. The music in the opening scene of “Power of Art” is lovely (Moonlight Sonata?), the music in the opening scene of “A history of Britain” is also very intriguing, anyone knows what it is?